PICTURES FROM A FOREST FIRE MODEL
The whole system is heated from below i.e. we are not in equilibrium.
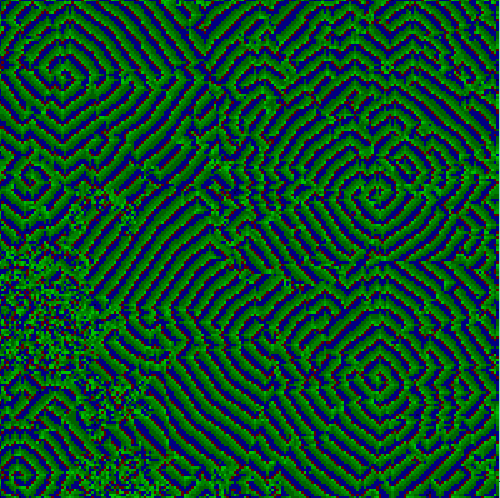
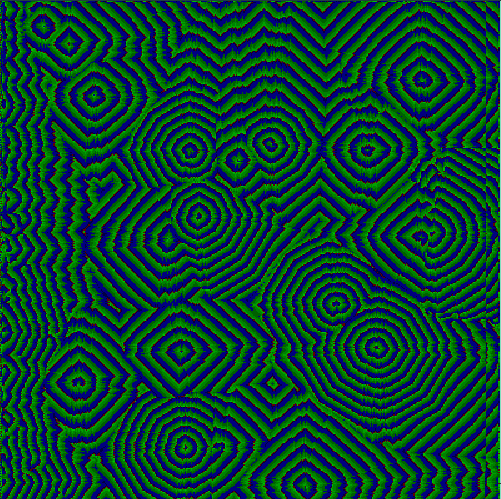
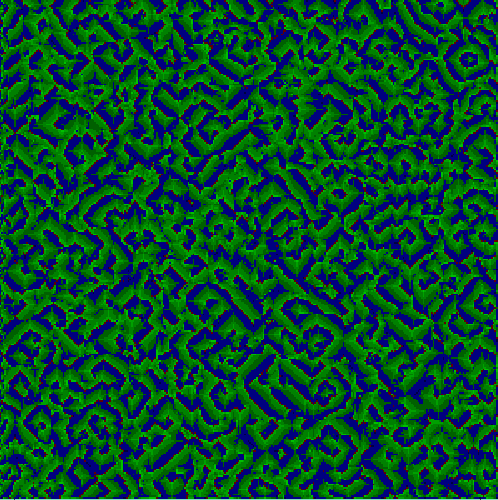
Red is FIRE that is a energy above some critical energy E_c green is TREE that is an energy between one and E_c and blue is EMPTY. On the right side are rgb-pictures with these colors only. The pictures on the left are with more colors. The deeper the green the lower the tree, the lighter the red the higher the fire, the darker the blue the lower the empty side. The initial conditon is produced with a random number generator. The sides are equally distibuted initialised with values between zero and E_c.
You can enlarge the pictures by clicking on them.
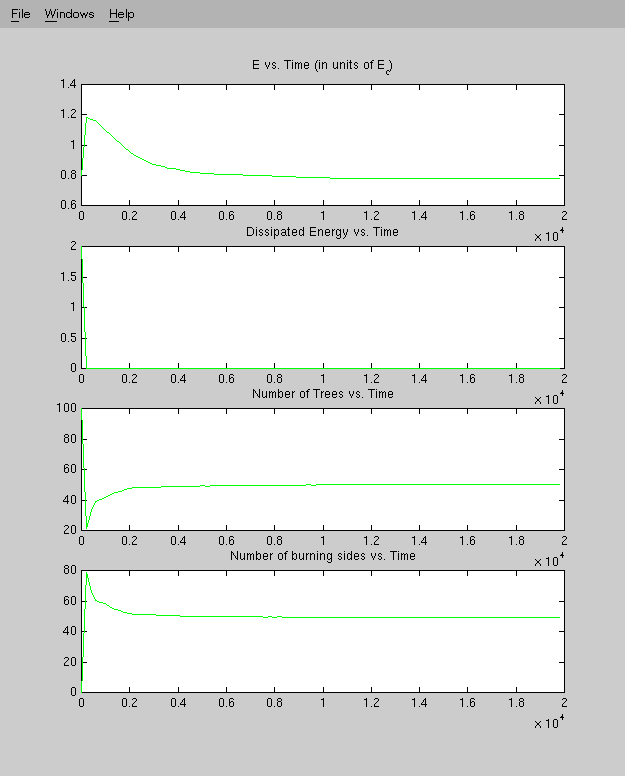
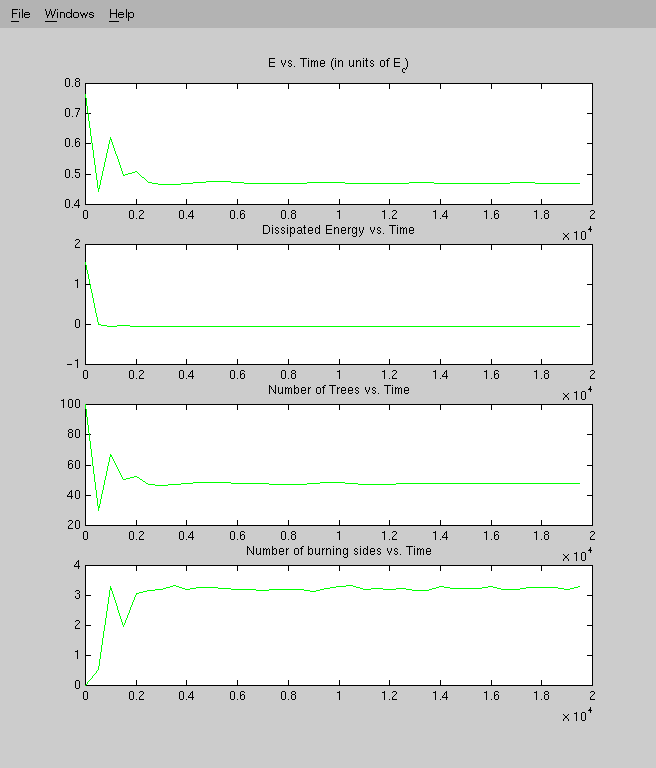
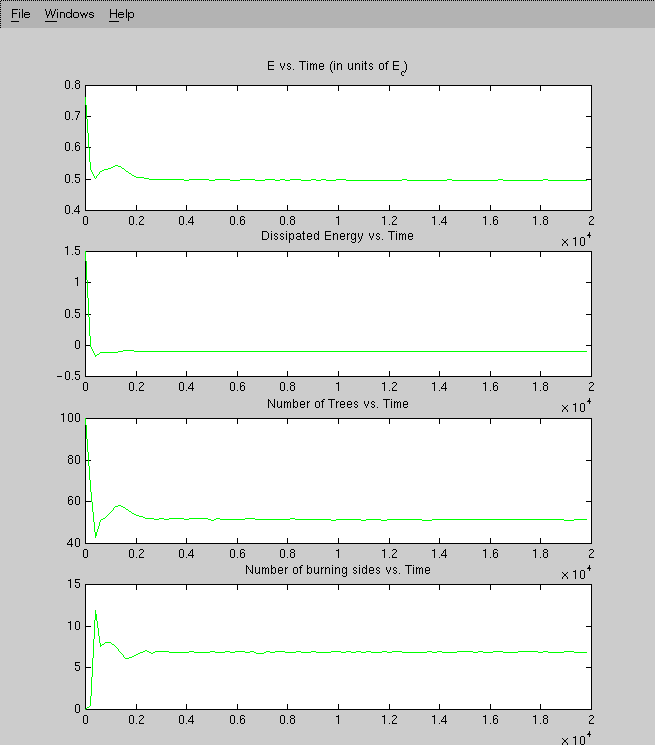
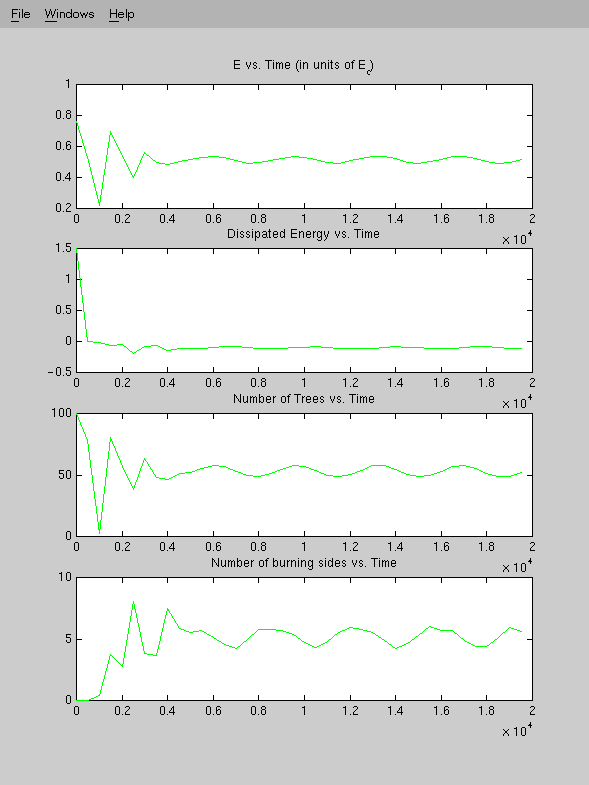
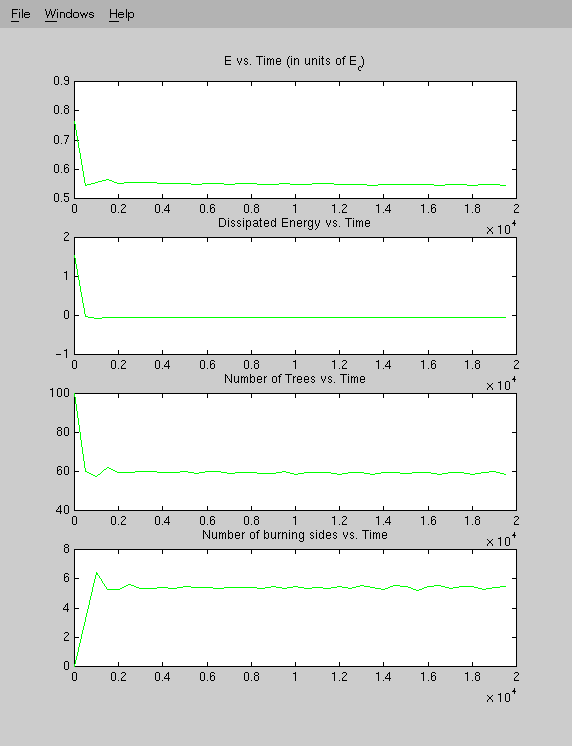
On the right side of each full color pattern is some "harder" information about the system. This can also be enlarged.
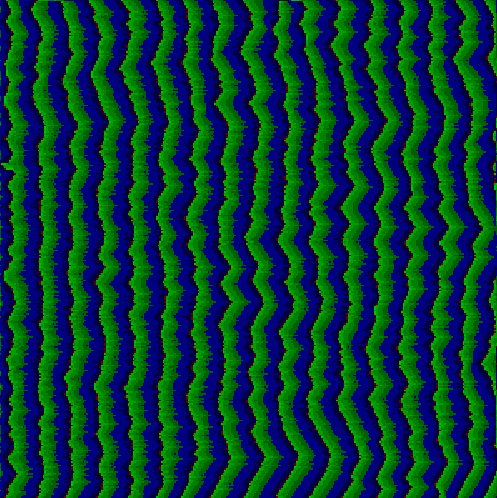
Here we additionally heat from the left side with double the critical energy
 |
 |
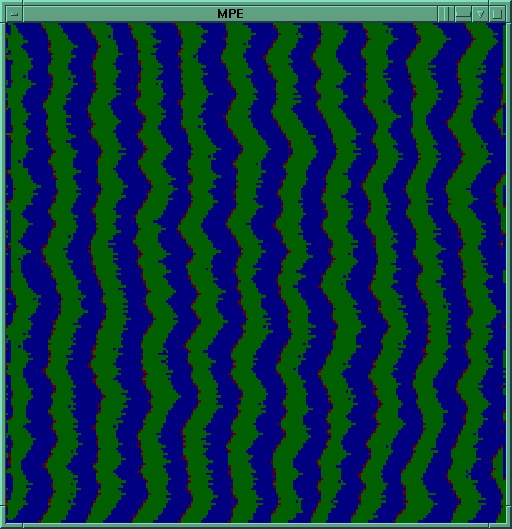 |
You can see ripples. The boundary is cyclic in y-direction.
This is also with the heating but in another parameter range
 |
 |
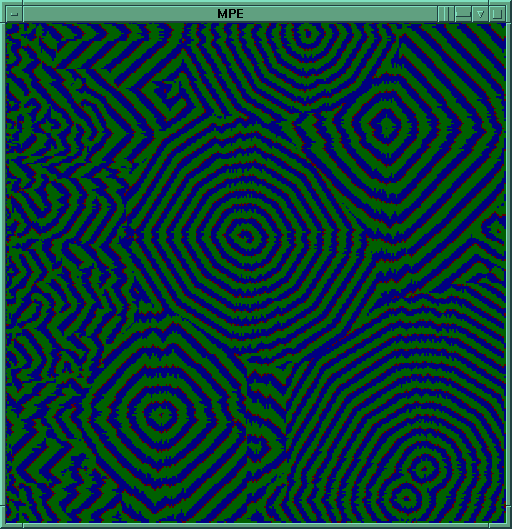 |
Here we have a target pattern with targets of different wavenunber.
Now wo turn of the side heating and take some other parameter ranges. The first picture shows an oszillation that can be seen in the data. Is is a very slow period. At the bottom of this side you can see a faster one.
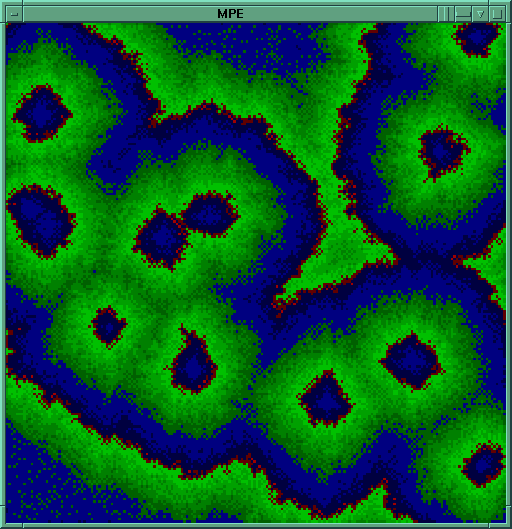 |
 |
These are some nice spirals. It takes 15000 iterations to see them.
This is in another range of the variables
 |
 |
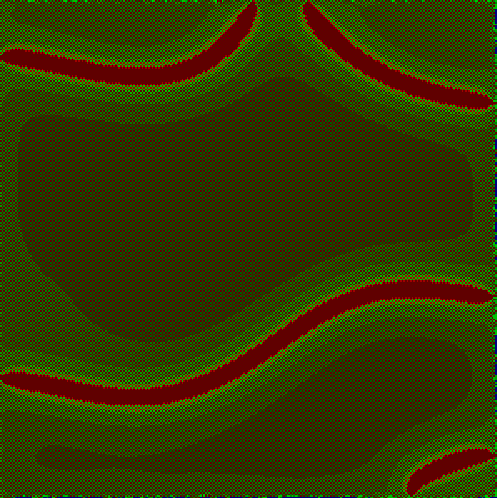
And now this is one of my favorite ones where we have localisation
 |
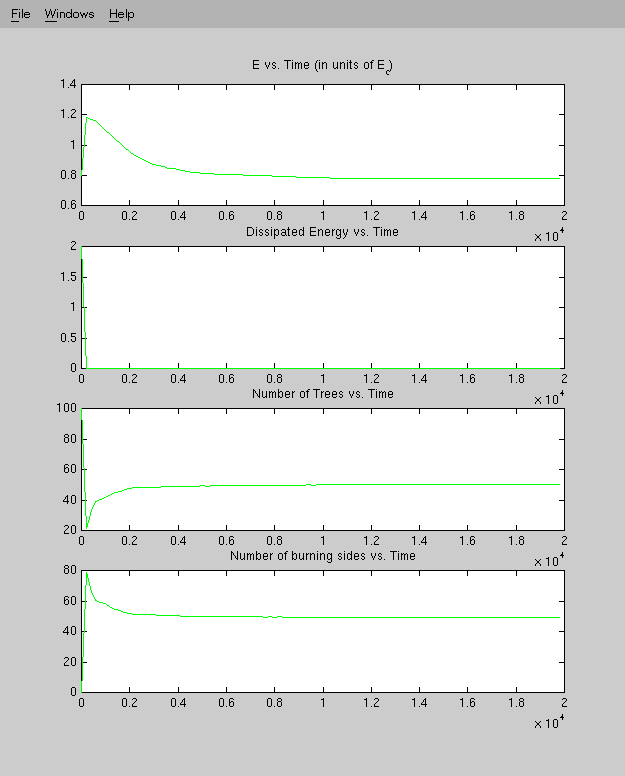 |
It is important for these structures that they are pinned at the boundary. If they form rings they become cycles where the radius becomes smaller and smaller and they die out.
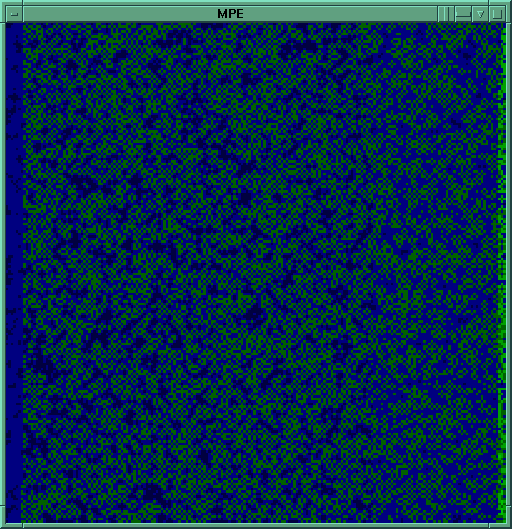
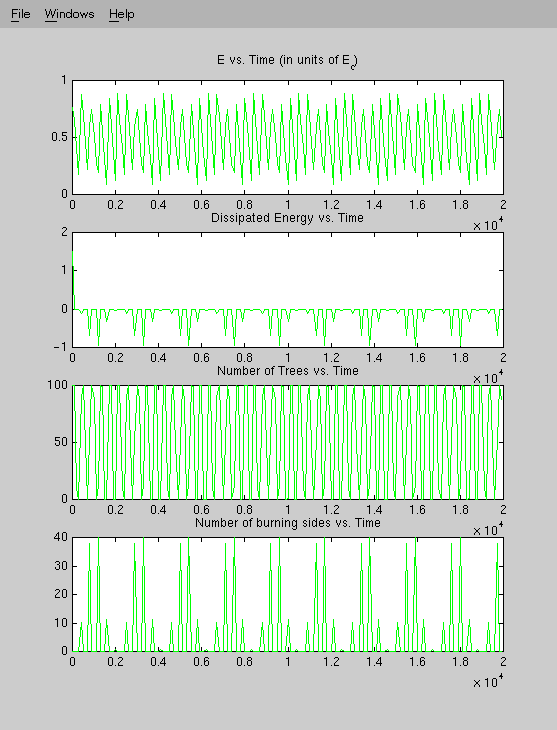
This is a picture of an oszillating pattern. It is clear when you look at the data. The different colors at the left and right side are because of difficulties in grapping the picture in an approbiate time.
 |
 |
All these pictures are produced with a program that is parallel (MPI hence MPE Surface). This is not necessary. It takes less than
10min with a single processor to produce these 200x200-field pictures and you can see online the developement of the structures.
I invented the model just for fun to learn parallel computing.
Just a short remark: In contrast to a lot of other pages on the web is this page finished. If you detect slight changes please be so kind to send me a message
 jens.kappey@physik.uni-magdeburg.de
 home, sweet home...


